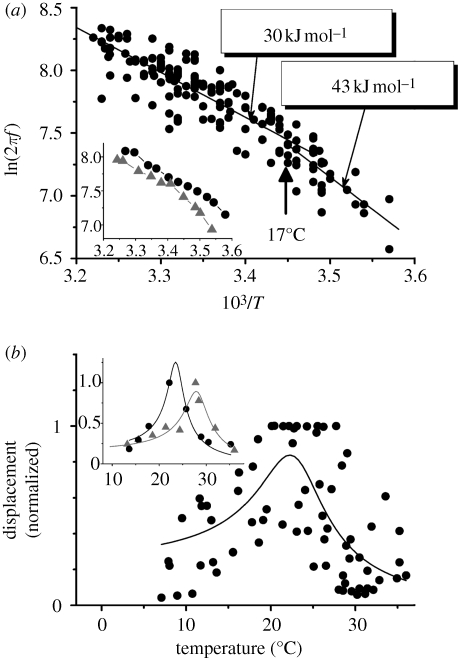
Figure 3.
Temperature-dependence of the mechanical spontaneous oscillations of the Johnston's organ. (a) Arrhenius plot of the SO frequency (the natural logarithm of the SO frequency against the inverse absolute temperature). Two linear regression plots are fitted to data pooled from 12 mosquitoes with a break point at about 17°C. The activation energy values are indicated for both linear regression plots. Inset shows the Arrhenius plots for two individual mosquitoes. (b) Temperature-dependence of the amplitude of mechanical SOs. Pooled data for nine mosquitoes are shown. A simple harmonic oscillator model was fitted to the dependence of the normalized amplitude of the SOs with respect to temperature. Inset illustrates the same model fitted to the temperature dependences from two individual mosquitoes.

