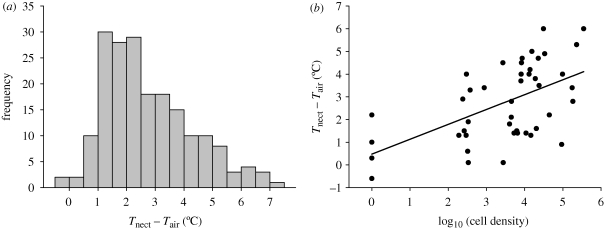
Figure 2.
(a) Frequency distribution of nectary temperature excess (ΔTnect = Tnect − Tair) in control H. foetidus flowers from experiment 1 (i.e. flowers exposed to natural pollinator visitation and presumably containing yeasts). (b) Relationship between nectary temperature excess and yeast cell density in the same nectaries of field-collected, non-experimental H. foetidus inflorescences exposed to pollinator visitation. Line is the least-squares-adjusted regression (y = 0.475 + 0.655x; r2 = 0.35, F1,44 = 24.0, p < 0.0001).

