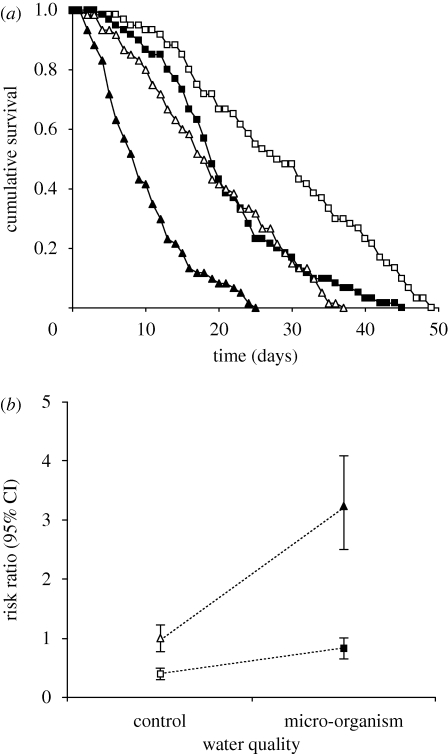
Figure 3.
Illustration of the significant interaction ‘status of infection × water quality’ highlighted in the survival analysis model: (a) cumulative survival and (b) risk ratio (with 95% confidence interval). Square: non-infected host. Triangle: infected host. Open symbol: control water. Filled symbol: micro-organism-enriched water.

