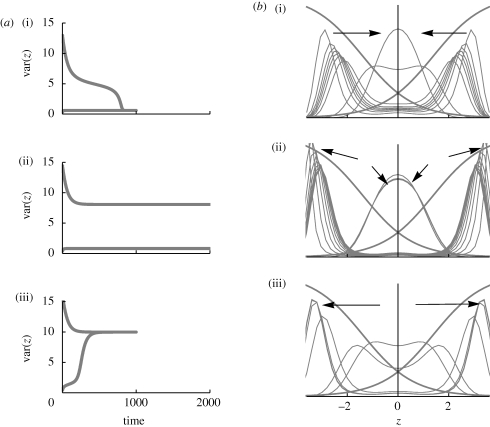
Figure 13.
Behaviour near the threshold between unimodal and bimodal equilibria. (a) Shows the trait variance, across both niches, against time, starting either from complete linkage disequilibrium (LD, a(i)) or linkage equilibrium (LE, a(iii)). There are n = 40 loci, β = 4, and niches are of equal size. The standard deviation at linkage equilibrium is  (a)(i)–(iii). (b) Shows the viabilities in each niche (thick curves; equation (2.3)), together with the trait distribution over successive generations. (i)
  , t = 100, 200, … , 1000, starting in LD; (ii)
  , t = 20, 40, … , 200, starting in LD and in LE; (iii)
  , t = 100, 200, … , 1000, starting in LE.

