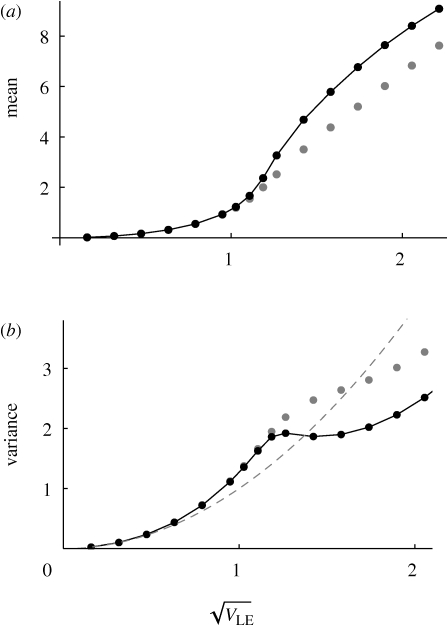
Figure 9.
The mean and variance within niches, plotted against the standard deviation at linkage equilibrium,  . The dots connected by a solid line show the exact solution, obtained by iterating until convergence. (Starting from linkage equilibrium, and from complete disequilibrium, led to the same values.) Grey dots show the Gaussian approximation. The dashed line in (b) shows the variance at linkage equilibrium, in the population as a whole. There are n = 40 loci, and equal niche sizes; β = 2; values are measured in the newborn population.

