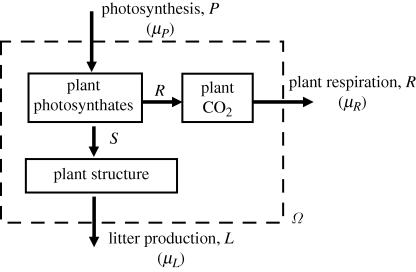
Figure 2.
Whole-plant carbon balance. Notation as in figure 1, except that the system boundary (Ω) has been extended to include plant structure (proteins, cellulose, etc.). L, plant litter production; μL, chemical potential of plant litter. In the steady state, R = P − L.

