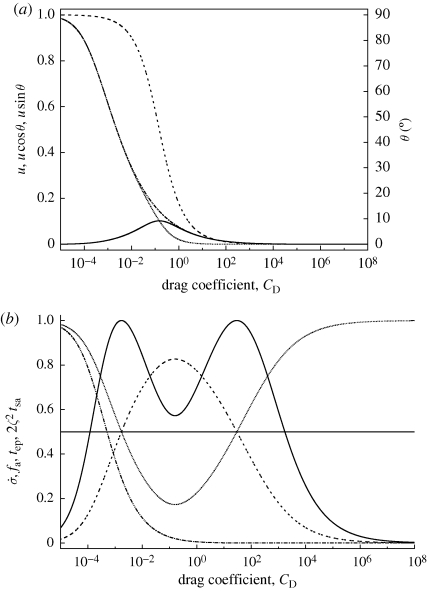
Figure 3.
Model solutions as a function of drag coefficient CD for Earth. Dynamical variables are shown in (a) and thermal variables are shown in (b). There are two LEB solutions for which  and hence
  . There is one MAF solution for which fa is maximized. The surface-to-atmosphere temperature difference tsa can be shown analytically to attain a maximum value 1/2ζ2. For clarity, therefore, the rescaled quantity 2ζ2tsa is plotted rather than tsa. Earth (ξ = 2.33 × 10², ω = 1.01 × 100, η = 2.19 × 10⁻³) (a) dash-dotted line, windspeed u; solid line, meridional wind u cos θ; grey line, zonal wind u sin θ; dashed line, angle θ. (b) solid line,
  ; dotted line, fa; dotted grey line, tep; dash-dotted line, 2ζ2tsa.

