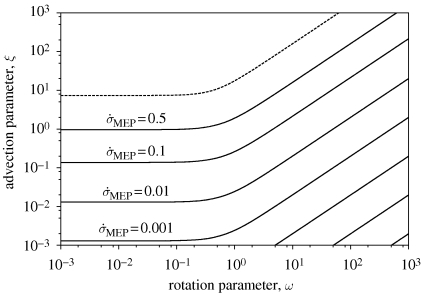
Figure 8.
Contours (solid line) of the rate of entropy production at MEP:  . Above the critical line (dashed line) (equation 4.5), the MEP state is an LEB state and so
  . Below the critical line, the MEP state is an MAF state and contours of
  are calculated numerically. The rate of entropy production in an MEP state is independent of rotation rate for all slowly rotating planets (
 ), and for all planets with sufficient advective capability (i.e. those above the critical line).

