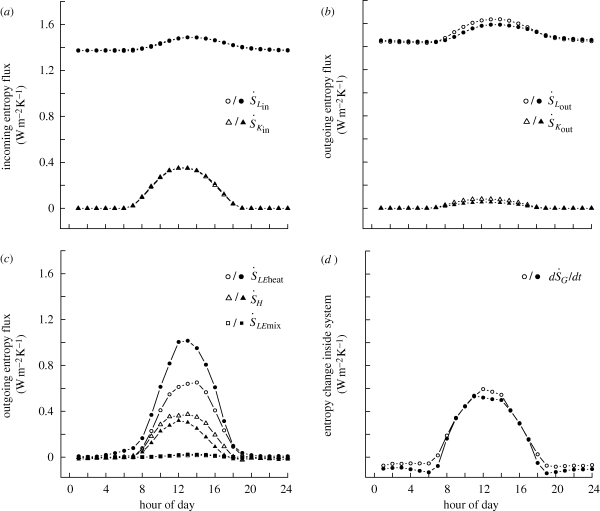
Figure 2.
Mean hourly rates of entropy flux associated with each component of the entropy production calculations (equation (2.3)). Data are from forest (closed symbols) and pasture sites (open symbols) in Rondonia, Southwest Amazonia. Panels are divided into entropy fluxes associated with (a) incoming radiation, (b) outgoing radiation, (c) sensible heat, latent heat and entropy of mixing and (d) entropy change within the system.

