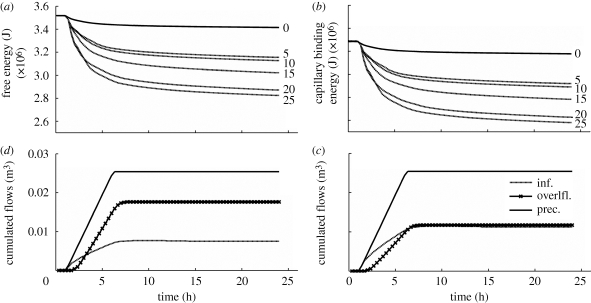
Figure 2.
(a) Free energy and (b) capillary binding energy plotted against simulation time for increasing density of worm burrows (given by the integers) during the 10 mm rainfall event. The solid line belongs to a zero burrow density; average worm burrow depth is 0.8 m. (d) Water balances namely accumulated rainfall, infiltration and overland flow for the rainfall event with 25 mm for the case of no worm burrows and (c) the case of nb = 25 m−2.

