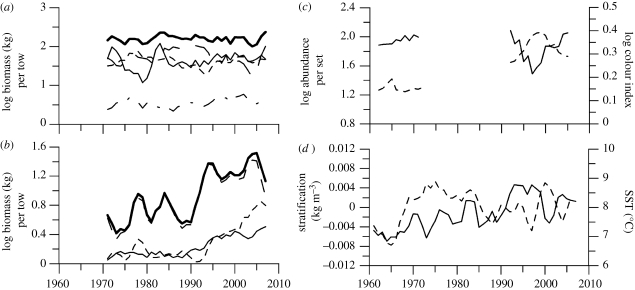
Figure 1.
Trophic and climate dynamics of the WSS, Northwest Atlantic from 1970 to 2008. (a) Aggregate biomass of top predators (sum of piscivores, large benthivores, medium benthivores and zoopiscivores) (thick solid); piscivores (long dash); large benthivores (short dash); medium benthivores (dash dot) and zoopiscivores (thin solid). (b) Aggregate prey biomass (sum of planktivores, macroinvertebrate and small benthivores) (thick solid); planktivores (long dash); macroinvertebrate (short dash); small benthivores (thin solid). (c) Herbivorous copepod abundance (solid) and colour index representative of phytoplankton abundance (dashed). (d) Stratification (solid) and SST (dashed). All lines are 3-year running averages.

