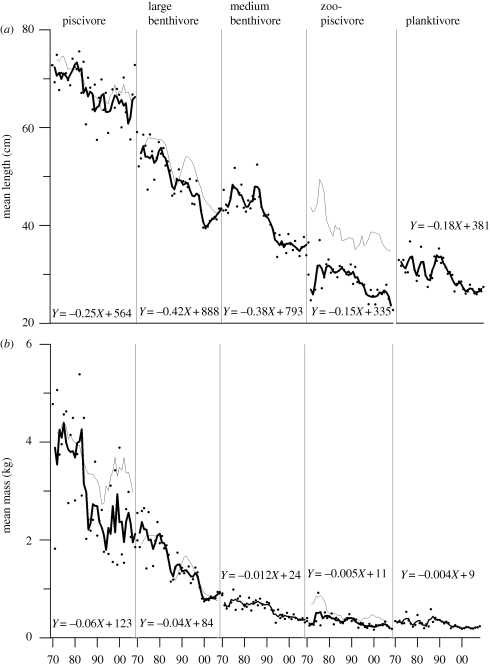
Figure 2.
(a) Mean length (cm) and (b) mean mass (kg) for fish functional groups from 1970 to 2008. Linear regression equations of body size through time are shown. Dots are annual values and lines show 3-year running averages. Grey lines denote the direct measure of growth ((a) length and (b) mass at age 6 as weighted by species biomass within a functional group).

