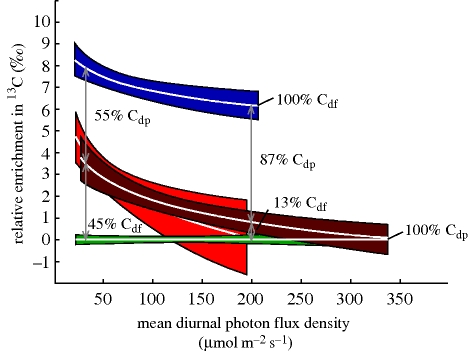
Figure 2.
Correlation between relative enrichments in 13C (ε) calculated per plot (Preiss & Gebauer 2008) and mean light availability based on the data shown in figure 1. Regression lines (±95% confidence intervals) represent the range of isotope signatures of autotrophic (green), partially myco-heterotrophic (light and dark red) and fully myco-heterotrophic plants (blue). Arrows indicate the variable proportion of carbon derived from fungi (Cdf) or photosynthesis (Cdp), respectively.

