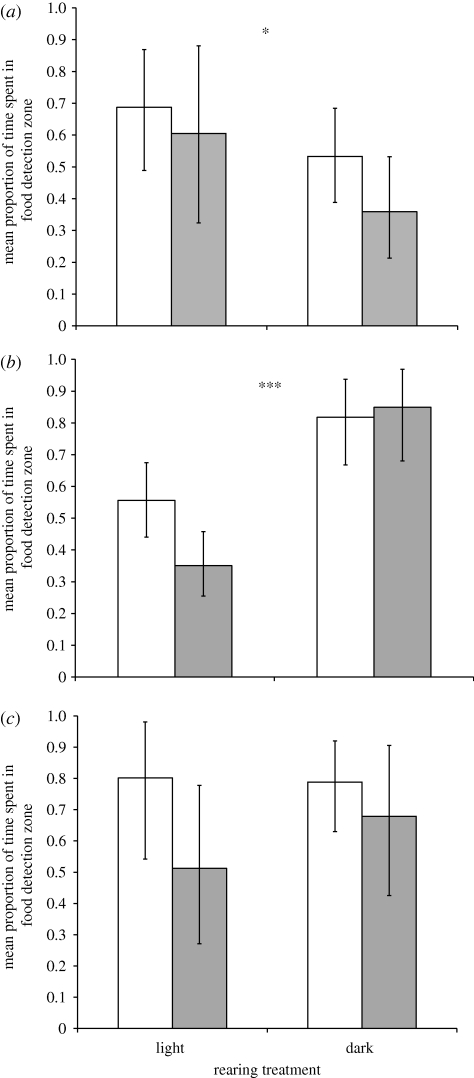
Figure 2.
Mean±2 s.e. proportion of time spent in the food detection zone back-transformed following an arcsin squareroot transformation) with (a) only visual cues available, (b) only olfactory cues available and (c) both visual and olfactory cues. Shaded bars indicate dark trial conditions; unshaded bars indicate high light trial conditions. Note that *p < 0.05; ***p < 0.001.

