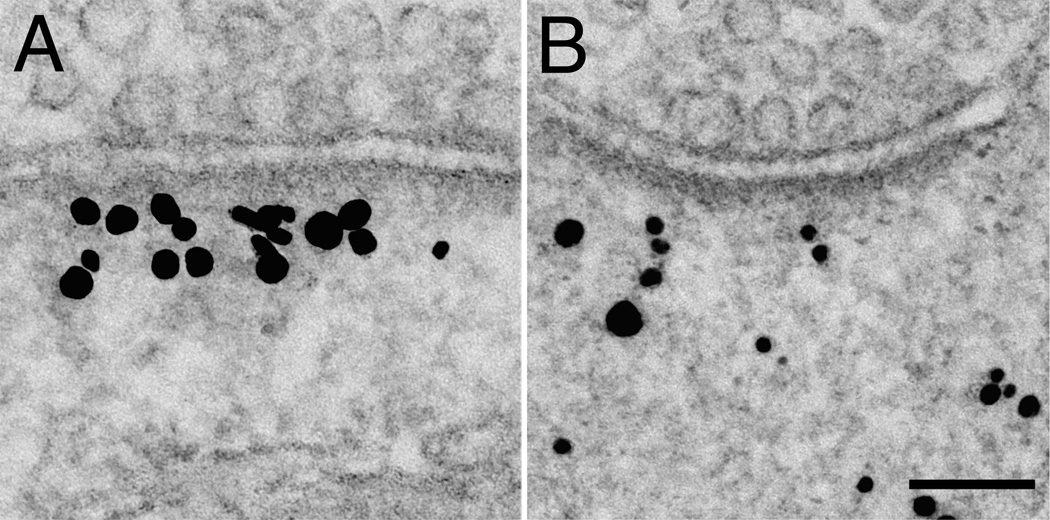
Figure 6.
Representative electron micrographs showing distributions of label for pan Shank in Zone I following two minutes high K+ either in the presence (A) or in the absence of external Ca2+ (B). The stimulation-induced clustering of label for Shank in Zone I, and the PSD curvature change appear to depend on external Ca2+. Scale bar = 100 nm.

