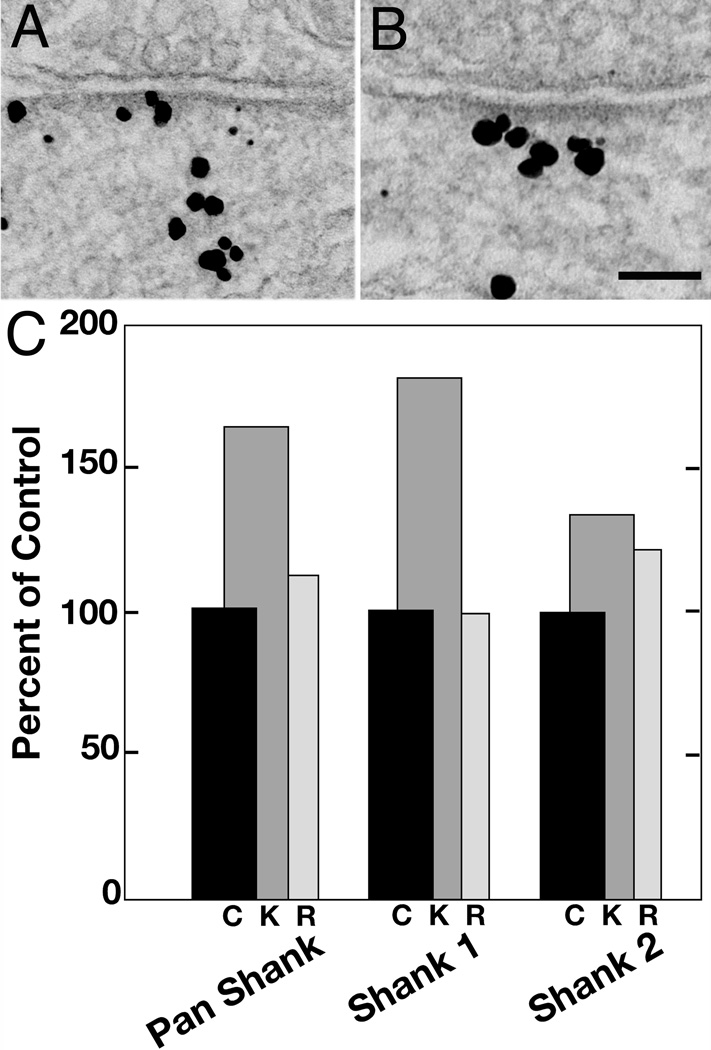
Figure 7.
Comparison of labeling in Zone I for Shank1 (A) and Shank2 (B), showing that label for Shank2 is localized closer to the PSD. Scale bar = 100 nm. C. Pooled results from all experiments expressed as percent of labeling in control (black bars labeled c (control), set at 100 percent). Normalization was necessary in pooling experiments because the overall level of labeling varied between experiments. After high K+, the percentage of Shank1 appearing in Zone I exceeded that of Shank2 (dark gray bars labeled K). In contrast, the label for Shank1 decreases more than that for Shank2 during the recovery period (light gray bars, labeled R).

