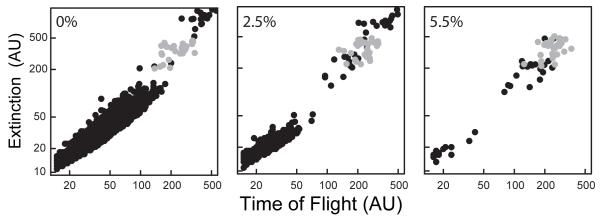
Figure 1. Scatter plots illustrating concentration-dependent decreases in C. elegans reproduction.
Extinction (log10 scale) plotted against time of flight (log10 scale) for untreated (left panel), 2.5% DMSO (center panel), and 5.5% DMSO (right panel) wild-type nematodes. C. elegans L4s (gray circles) were loaded at t=0 h. After 48 h, the nematodes were recovered as adults and their offspring (black circles). Each point corresponds to a single nematode. (AU, arbitrary units)

