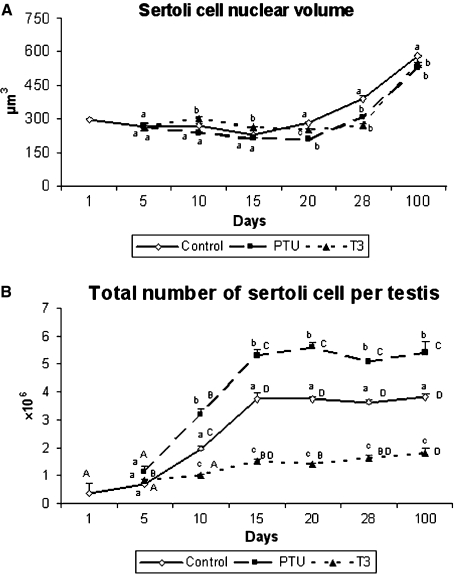
Fig. 9.
Sertoli cell nuclear volume (A) and total number of Sertoli cells per testis (B) in controls, propylthiouracil PTU- and T3-treated mice killed at different ages. Different lowercase letters for the same age indicate significant differences (P < 0.05) between treatments and different uppercase letters indicate significant differences between the ages investigated (P < 0.05) (mean + SEM).

