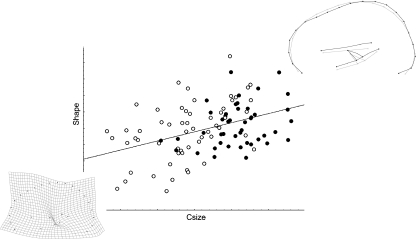
Fig. 3.
Multivariate regression of shape (Procrustes coordinates) onto centroid size (males: black dots; females: white dots). The wireframe shows the pattern of covariation along the allometric vector. The deformation grid shows the reverse pattern (from larger to smaller size) after magnification, showing a crease at thalamic area.

