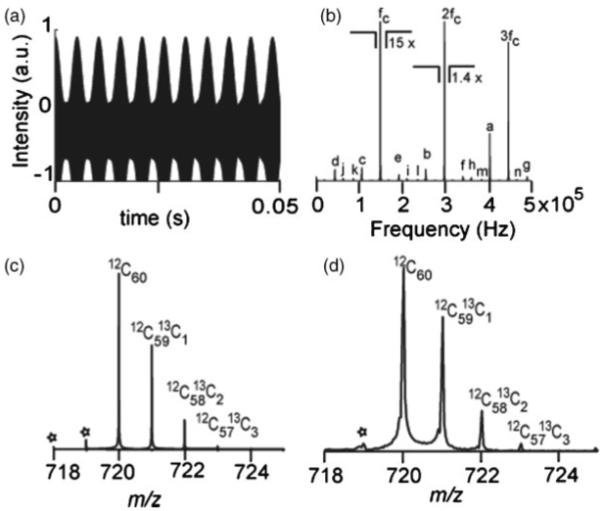
Figure 3.

C60 signal with asymmetric overloading of the ADC. (a) Simulated transient. (b) Simulated frequency spectrum showing artifacts at odd and even harmonics of the cyclotron frequency, FFT of (a). The peak labels are defined in Table 1. (c) Simulated mass spectrum with 1 Da spacing artifacts due to intermodulation of the C60 isotope signals. (d) Experimental mass spectrum obtained by MALDI-FTMS showing the 1 Da neighboring artifacts, “*”.
