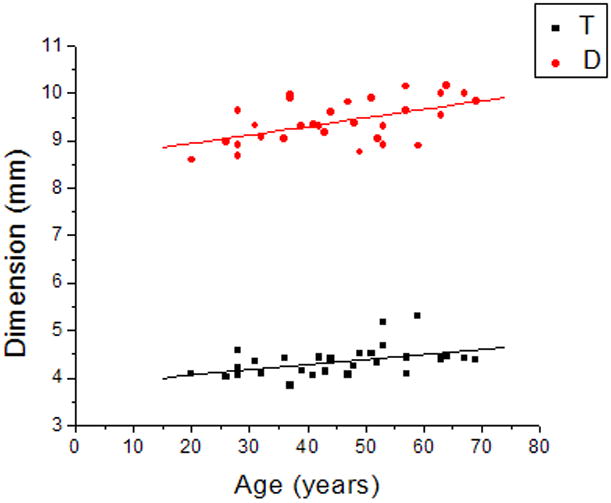
Figure 3.

Linear regression of thickness (T) and diameter (D) of the human crystalline lens with age yielded T = 3.8 (±0.9) + 0.01(±0.004) × Age (R=0.45, p=0.01) and D = 8.6 (±0.3) + 0.02(±0.01) × Age (R=0.53, p=0.002).

Linear regression of thickness (T) and diameter (D) of the human crystalline lens with age yielded T = 3.8 (±0.9) + 0.01(±0.004) × Age (R=0.45, p=0.01) and D = 8.6 (±0.3) + 0.02(±0.01) × Age (R=0.53, p=0.002).