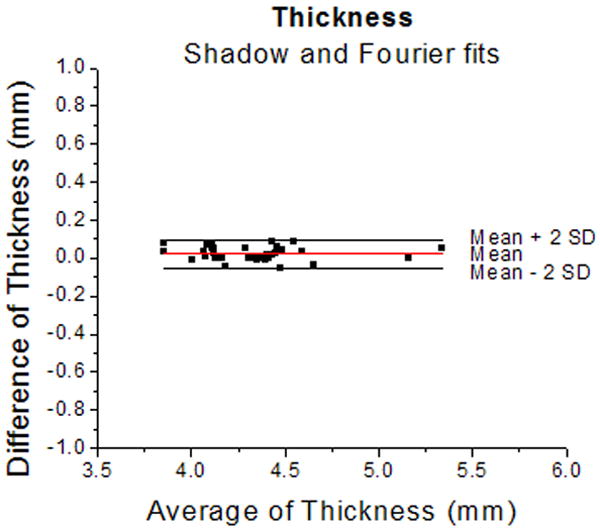
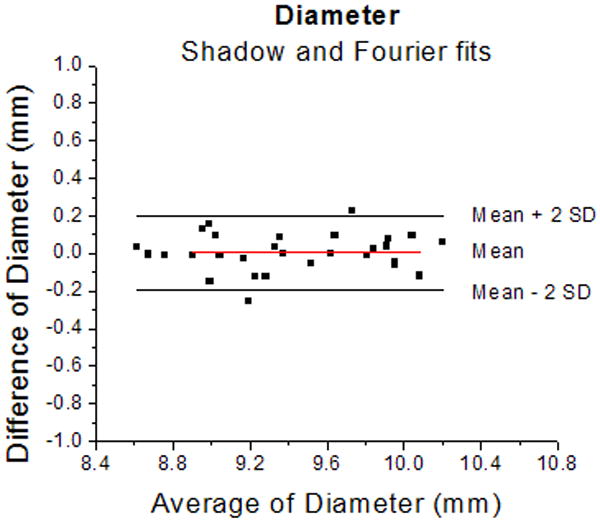
Figure 4.


Bland-Altman plots for thickness (4a) and diameter (4b) of the lens measured from shadow-photogrammetric images and from Fourier function fits. Most measurements were within 2 standard deviations of the mean measurement error. The mean measurement error was 0.02±0.04 mm for the thickness and 0.01±0.1 mm for the diameter. These results indicate that measurements from both methods are the same.
