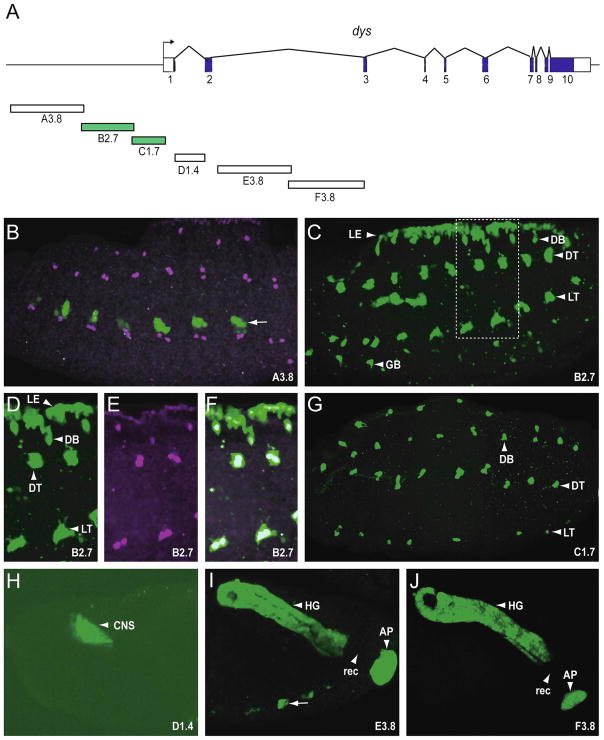
Fig. 1.
Transgenic analysis of the dys regulatory region. (A) Schematic illustrating 32 kb of the genomic region encompassing the dys gene. The 10 dys exons are indicated as blocks: coding sequences are filled and untranslated regions unfilled. The direction of transcription is indicated by the arrow. Fragments analyzed as reporter transgenes are labeled A–F with the size of the fragment in kb included. Fragments colored green indicate they drove expression in fusion cells. Stage 15 or 16 embryos from transgenic reporter-GFP strains were stained with anti-GFP (green) and anti-Dys (magenta) antibodies. All images depict sagittal views and anterior is to the left. (B) A3.8 drove GFP expression in subsets of ectodermal cells (arrow: here and throughout) that did not overlap with Dys+ cells. These cells were commonly observed with pMintGate transgenes that were introduced at the attP2 site at 68A1-B2, independent of the fragments being tested. (C) B2.7 drove GFP expression in leading edge (LE) cells and all tracheal fusion cells, including DB, DT, LT, and GB. (D–F) Enlarged image of the rectangle shown in C, indicating anti-GFP reactivity overlapping with anti-Dys reactivity in fusion cells and leading edge; (D) GFP only, (E) Dys only, (F) merge. (G) C1.7 drove GFP expression in all fusion cells. (H) D1.4 drove GFP expression in CNS brain cells. (I–J) Both E3.8 and F3.8 drove expression in hindgut (HG) and anal pad (AP). There was an absence of expression in the rectum (rec). This pattern of expression is identical to endogenous dys.

