
Fig. 3.
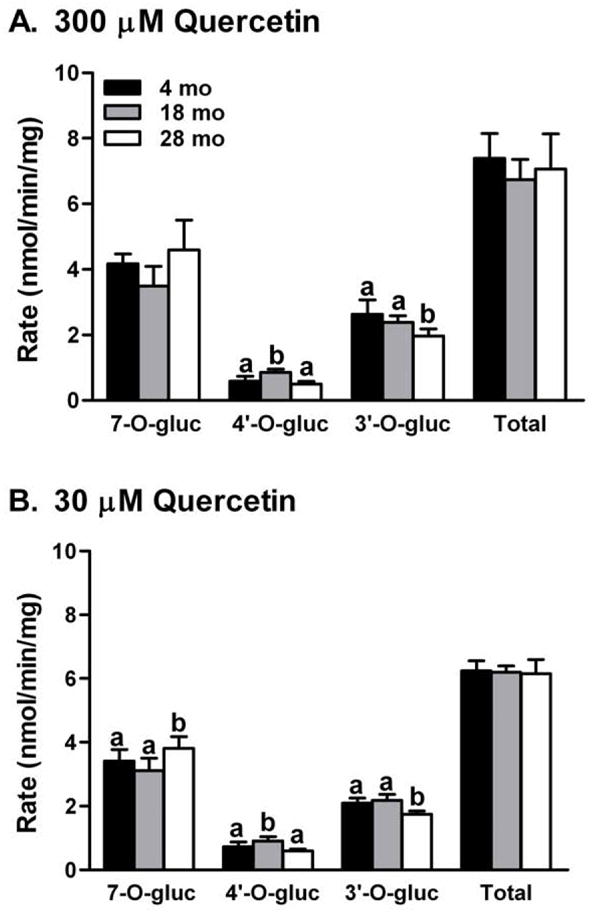
Age-related changes in glucuronidation activities toward quercetin catalyzed by hepatic microsomal UGT of male F344 rats. Quercetin concentration at 30 μM was in range of the Km value for total glucuronide metabolite formation. Data are expressed as mean ± SD (n = 5/group). P values of one-way ANOVA for 30 μM quercetin were 0.0381 for 7-O-gluc, 0.0034 for 4′-O-gluc, 0.00089 for 3′-O-gluc, and 0.93 for total glucuronides, respectively. P values of one-way ANOVA for 300 μM were 0.058 for 7-O-gluc, 0.0009 for 4′-O-gluc, 0.016 for 3′-O-gluc, and 0.50 for total glucuronides, respectively. abcMeans within the same metabolite without the same letter differ, Tukey’s HSD multiple comparison test, P ≤0.05.