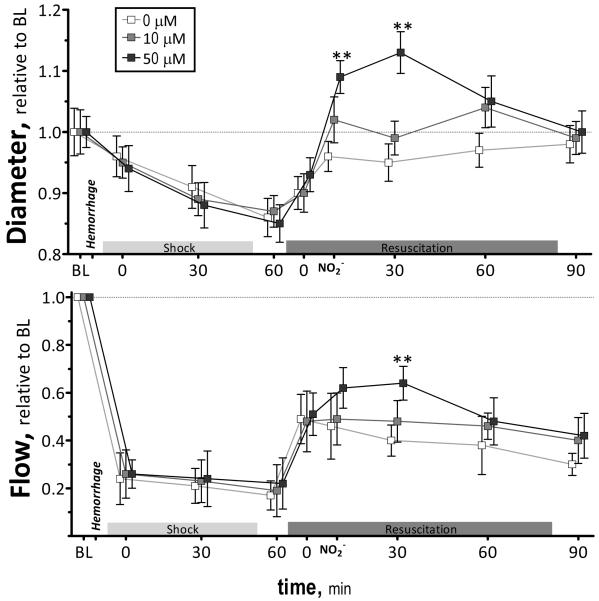
Figure 2.
Relative changes in arteriolar diameter and blood flow during the hemorrhagic shock resuscitation for all groups. Diameters (μm, mean ± SD) in each animal group were as follows: Baseline: 0μM (arterioles (A): 61 ± 9, n = 44); 10μM (A: 60 ± 8, n = 45); 50μM (A: 63 ± 9, n = 44). n = number of vessels studied. RBC velocities (mm/s, mean ± SD) for each animal group were as follows: Baseline: 0μM (A: 4.5 ± 0.9); 10μM (A: 4.4 ± 0.8); 50μM (A: 4.4 ± 0.7). Calculated flows (nl/s, mean ± SD) were as follows: Baseline: 0μM (A: 13 ± 4); 10μM (A: 12 ± 3); 50 μM (A: 12 ± 4). Broken line represents baseline level. **, P<0.05, 50μM compared to 0μM and 10μM.

