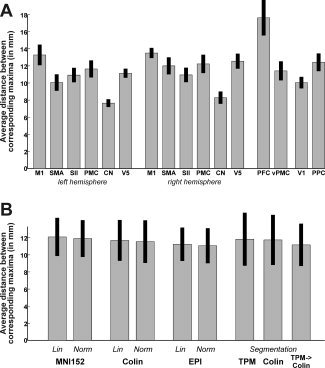
Figure 2.

Mean Euclidean distance between corresponding maxima (computed pairwise for all possible combination of group‐analyses) shown separately for each region (A: averaged over normalization approaches) and normalization procedure (B: averaged across regions). The average across all areas and normalization s, i.e., the estimate of the between subject variance (EDsub) was 11.6 mm. In A, bars denote the standard deviation across normalization approaches, in B across regions.
