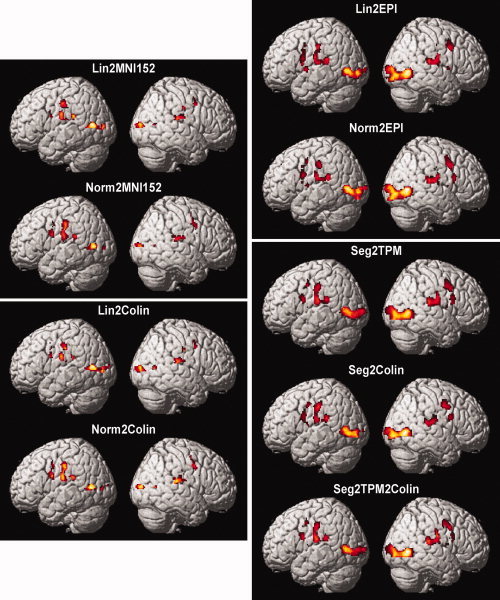
Figure 3.

Significant results for the contrast “L > 0 ∩ R > 0”, i.e., regions that were considered active independently of the moved hand at a threshold of P < 0.001 (uncorrected). Data is shown for each of the nine group analyses performed in identical fashion on the same subjects but differing in the approaches used to transform each subject's data into MNI space. All results are displayed on a surface view of the MNI single subject template. The juxtaposition of these results illustrates that in spite of identical primary data and statistical processing, the results of fMRI group analyses are indeed influenced by the applied spatial normalization. A more detailed description and in particular a quantitative assessment of these spatial normalization effects on the stereotaxic location of local maxima (equivalent to the between‐template variance in meta‐analyses) are provided in the main text.
