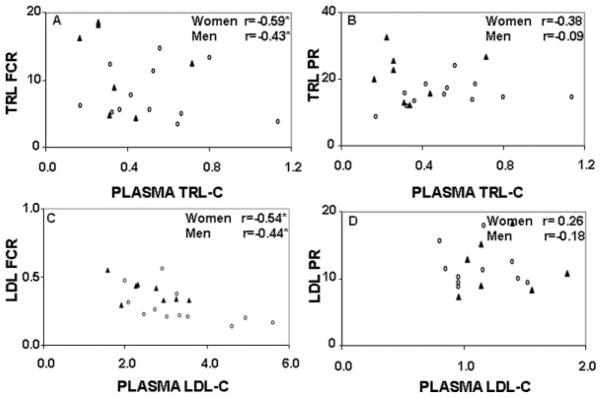
Figure 2.
Correlation between plasma TRL-C concentrations (mmol/L) and TRL apoB-100 FCR (pools/d; A) and TRL apoB-100 PR (mg/kg/d; B); plasma LDL-C concentrations (mmol/L) and LDL apoB-100 FCR (pools/d; C) and LDL apoB-100 PR (mg/kg/d; D). The (▲) represents the premenopausal women, and the (○) represents the men. *P<0.05.

