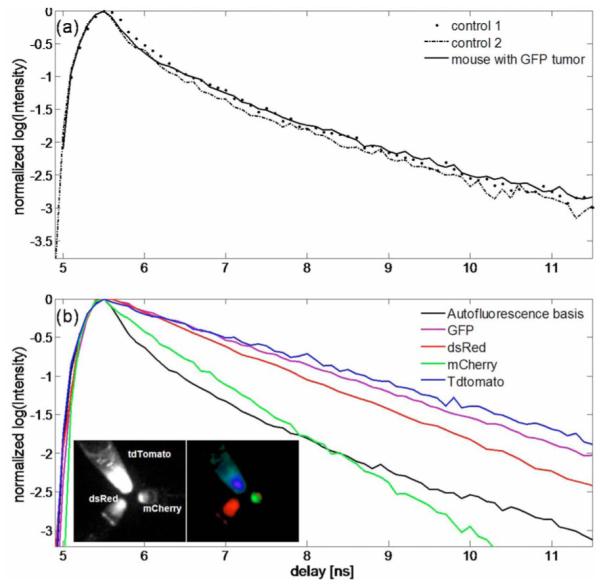
Fig. 2.

(Color online) (a) Representative AF decays obtained from two control nude mice and from a control region of a mouse with a localized tumor. (b) Global AF decay generated from the control mouse data (black) compared with the decays of FPs measured in vitro. The FP decays were exponential with lifetimes: GFP, 2.8 ns; dsRed, 2.5 ns; mCherry, 1.5 ns; and tdTomato, 3.4 ns. tdTomato, mCherry, and dsRed were excited at 543 nm (10 nm width) and detected with a 580 nm long-pass filter. GFP was excited at 480 nm (10 nm width) and detected using a 515 nm long-pass filter. The insets in (b) show the CW reflectance image (left) of tubes containing equal concentrations of tdTomato, dsRed, and mCherry, and the amplitude components (right) of a three-exponential fit using the averaged decays of the three FPs. The amplitudes are shown as red (dsRed), green (mCherry), and blue (tdTomato).
