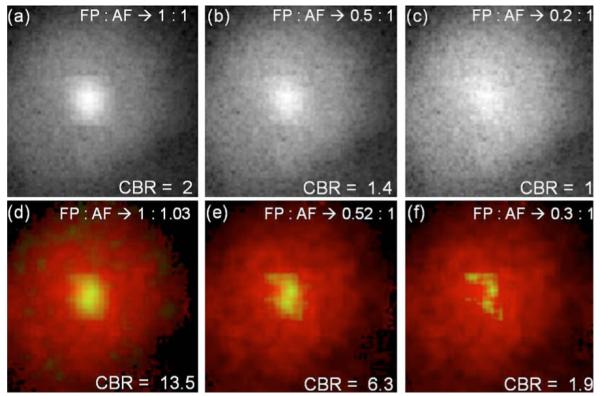
Fig. 3.

(Color online) Simulations to test the efficiency of AF separation. (a)–(c) Continuous-wave images of simulated exponential decays within a≈1 cm diameter area added to an experimetal AF image from a control mouse with planar illumination. The ratios between the FP and AF images correspond to ratios of the maximum CW intensities of the FP and AF decays. (d)–(f) show the decoupled AF (red online, exterior color) and the FP (green online, interior color) decay amplitudes obtained using Eq. (1), as the red and green components of an RGB image matrix. Thus yellow (online) indicates the degree of overlap. The FP amplitude is scaled by a factor of 2 in. (e) and 4 in. (f) for clarity. The corresponding FP:AF ratios recovered by the fit are indicated in (d)–(f).
