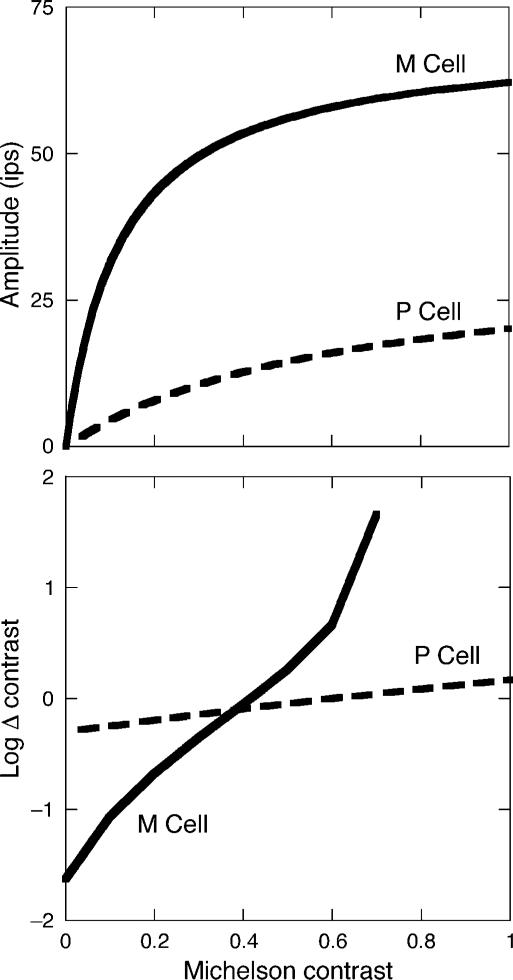
Figure 1.
(Top) Contrast response functions of prototypical M (solid curve) and P (dashed curve) cells plotted as a function of Michelson contrast. The data (only the fitted Michealis–Menten curves shown) are from Kaplan and Shapley (1986) and represent average responses from 36 ganglion cell (impulses per second, ips) recordings in a rhesus monkey LGN. The stimuli were optimal spatial frequencies for each cell and were modulated at 4 Hz. Rmax was 65 and 45 ips, and Csaturation was 0.13 and 1.74 for the M and P functions, respectively. (Bottom) Predicted physiological contrast detection and discrimination for the M (solid curve) and P (dashed curve) pathways, plotted as a function of Michelson contrast. Predictions are based on Equation 2 using data reported in Kaplan and Shapley (1986) and a criterion of 10 ips. After Pokorny and Smith (1997), with permission.

