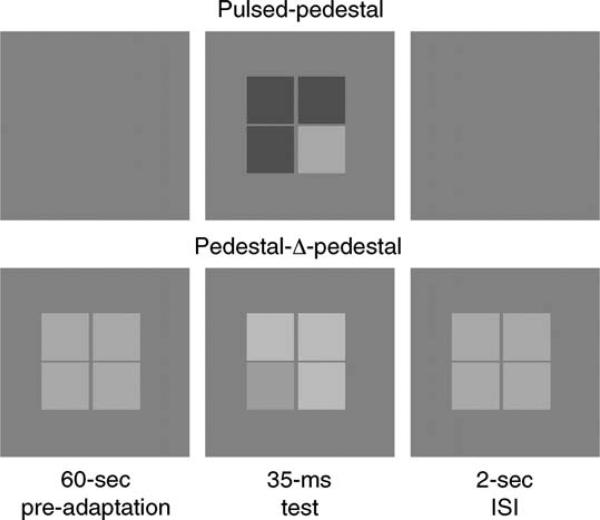
Figure 2.
Example of the testing sequence. (Top) The pulsed pedestal condition. Observers first adapted to a uniform field for 60 s. The test stimulus array was pulsed for 35.29 ms and included 3 squares at the pedestal luminance and one test square as an increment or decrement to the other three. (Bottom) Pedestal–Δ-pedestal condition. Observers adapted to the uniform field plus pedestal for 60 s, followed by the 35 ms test, where three squares were changed as an increment or decrement to the pedestal luminance. The test square increased or decreased by a slightly different amount.

