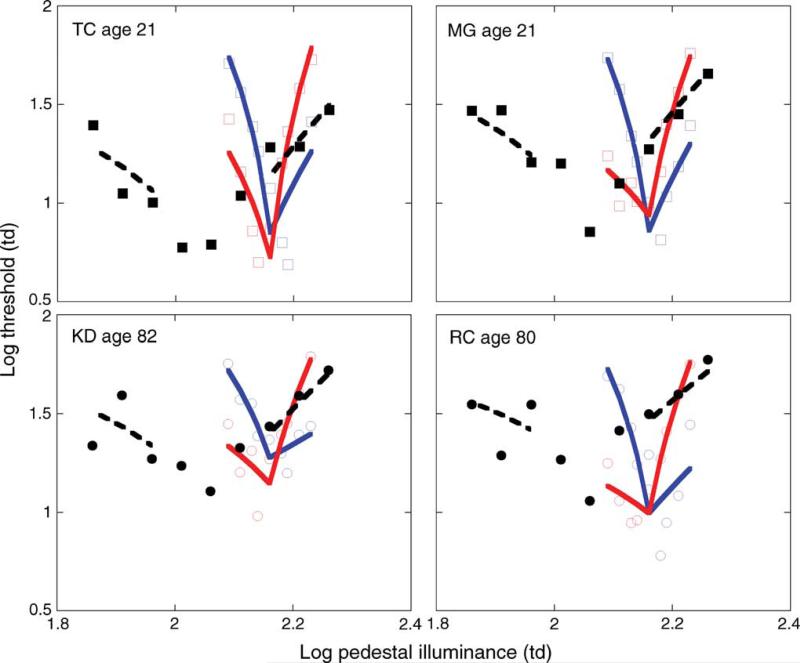
Figure 3.
Data from (top) two younger and (bottom) two older observers. Solid symbols denote discrimination thresholds for the pulsed pedestal, open symbols denote discrimination thresholds for the pedestal–Δ-pedestal paradigm. Dashed and solid lines denote fits to the data generated from Equations 3 and 4, respectively. Error bars are not included for clarity.

