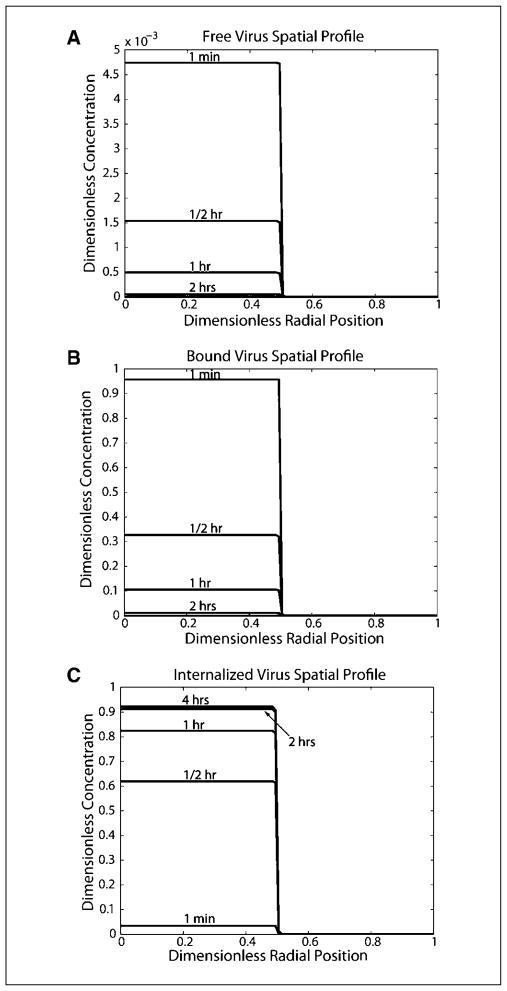
Fig. 2.
Spatial profiles for free, bound, and internalized virus using baseline parameter values. Virus concentrations have been normalized to the initial free viral concentration in the injection site. The radial position has been normalized to the tumor radius (with 0 being the tumor center, 0.5 being the edge of the initial injection site, and 1.0 being the tumor edge). A, free virus spatial profile. B, bound virus spatial profile. C, internalized virus spatial profile.

