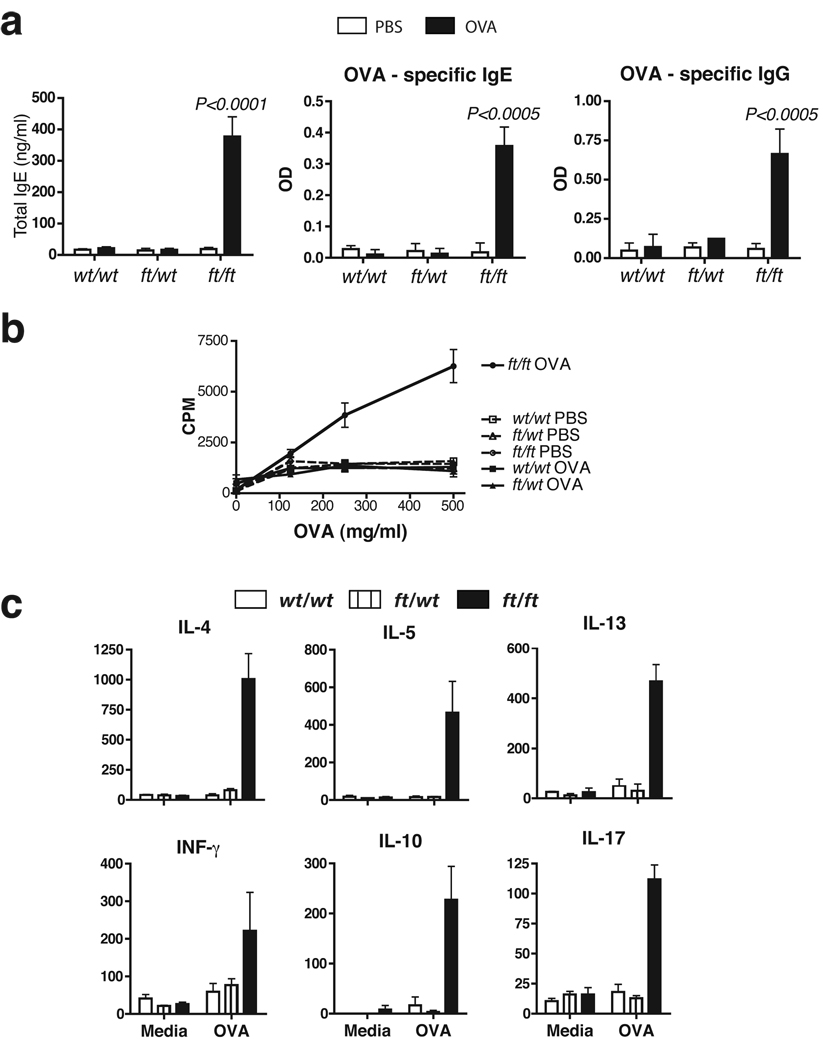
Figure 5. Elevated OVA-specific immune response in allergen exposed ft/ft mice but not wt/wt or wt/ft animals.
(a) ELISA detection of levels of total IgE, OVA-specific IgE and IgG in serum from wt/wt, wt/ft and ft/ft mice treated with PBS or OVA on skin. Data are Mean plus Standard Error of the Mean (SEM) from 7–12 mice.
(b) Cell proliferation to OVA of spleen cells from wt/wt, wt/ft and ft/ft mice treated with PBS or OVA on skin. Data represent the mean of spleens from 3–4 individual mice per group; error bars represent standard error of the mean.
(c) Cytokine production by spleen cells from OVA exposed wt/wt, wt/ft and ft/ft mice treated with PBS or OVA. Cells were cultured in media or OVA (500 µg/ml) and cytokines detected by ELISA. Data represent the mean of spleens from 3–4 individual mice per group; error bars represent standard error of the mean. Student’s t-test, or corrected Welch corrected t-test, was used to determine statistical differences between groups. NS = Non-significant.

