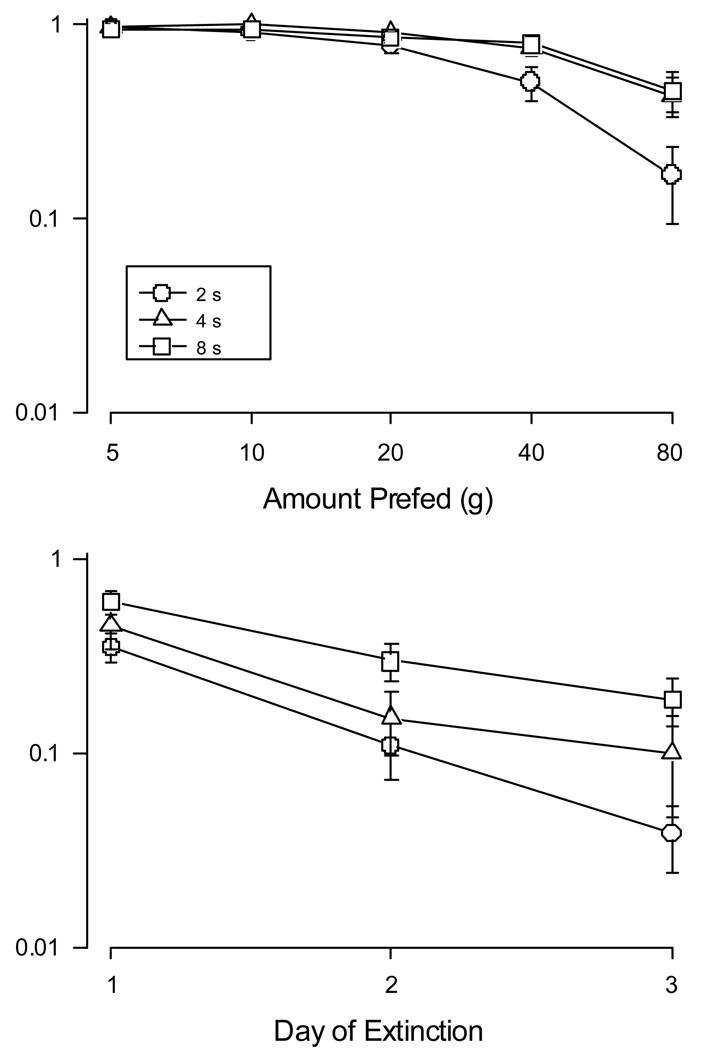
Figure 2.
(Upper) Key pecks per minute, expressed a proportion of control rates, are plotted against amounts of food fed to pigeons 30 min prior to experimental sessions. Note the double logarithmic axes. Circles represent data obtained from the multiple schedule component arranging 2-s access to food, triangles represent similar data from the component arranging 4 s of food, and squares the component arranging 8-s access to food. Error bars denote the standard error. (Lower). Relative response rates are plotted for each schedule component over successive sessions of extinction. Note the axes are log-linear. Details are the same as in the upper graph.

