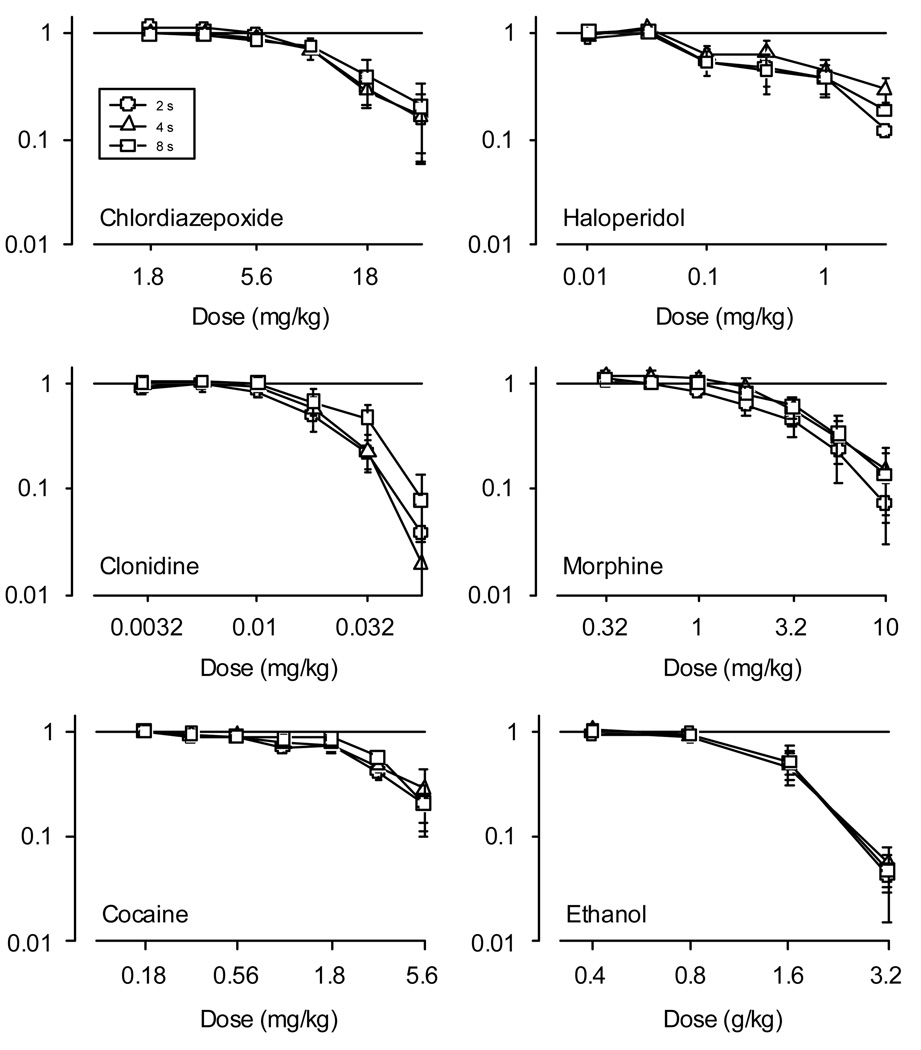
Figure 3.
Relative response rates are plotted against dose in mg/kg or g/kg (ethanol) for each of six drugs tested (see Table 1 for details). Note the double logarithmic axes. Each point is the mean of the average dose-response function obtained from each pigeon. Circles, triangles, and squares denote data obtained from multiple schedule components arranging 2 s, 4 s, or 8 s of food access, respectively. Horizontal lines at 1 indicate no change from control values. Error bars denote the standard error.

