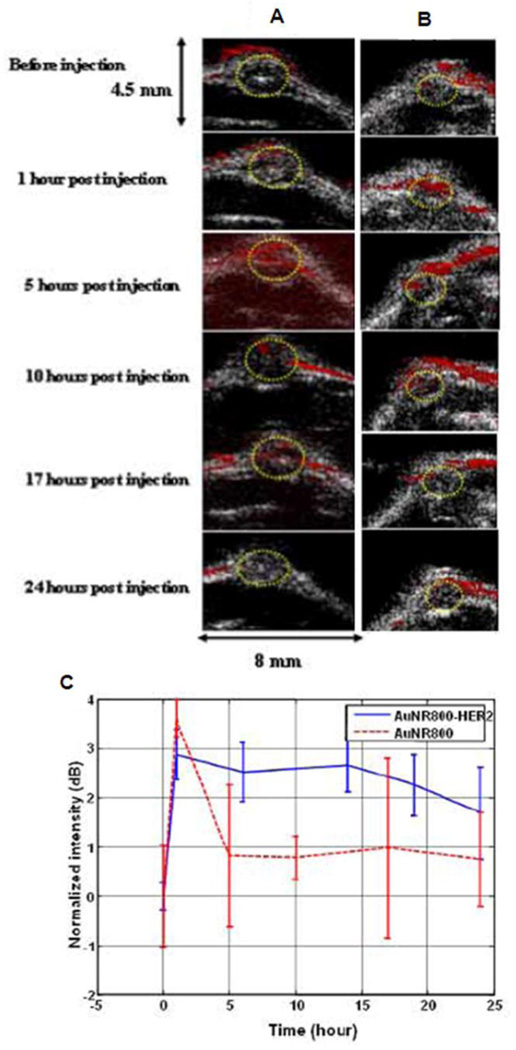
Figure 42.
In vivo noninvasive molecular PA Images of OECM1 tumors before and after the injection of AuNR785-HER2 and AuNR785. Ellipses indicate the tumor regions. (A) Time-course composite of US and PA images before and after AuNR785-HER2 injection. US image in gray scale and PA image in red pseudo-color. (B) Time-course composite of US and PA images before and after AuNR785 injection. (C) Averaged image intensities within the tumor region as a function of time after injections of AuNR785-HER2 (blue solid line) and AuNR785 (red dashed line). (Reprinted with permission from ref 18. Copyright 2008 The Optical Society of America.)

