
Figure 3.
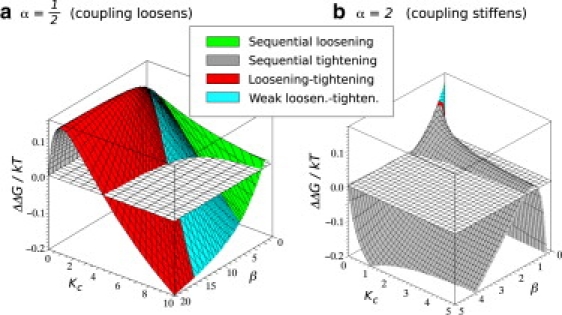
Four regions with different change in fluctuations mapped onto the ΔΔG landscape for α = 1/2 (a) and α = 2 (b). Color code: In the red region, the loosening-tightening effect is observed. The fluctuations of the doubly liganded system are smaller than that of the apo-protein. The blue region is characterized by the weak loosening-tightening effect, whereby the doubly liganded system moves more than the apo-protein, but less than the 1:1 system. The green region is characterized by sequential stiffening of the protein upon binding. In the gray region, each binding increases the fluctuations. The green region for α > 1 is hidden behind the peak in this view.