
Figure 2.
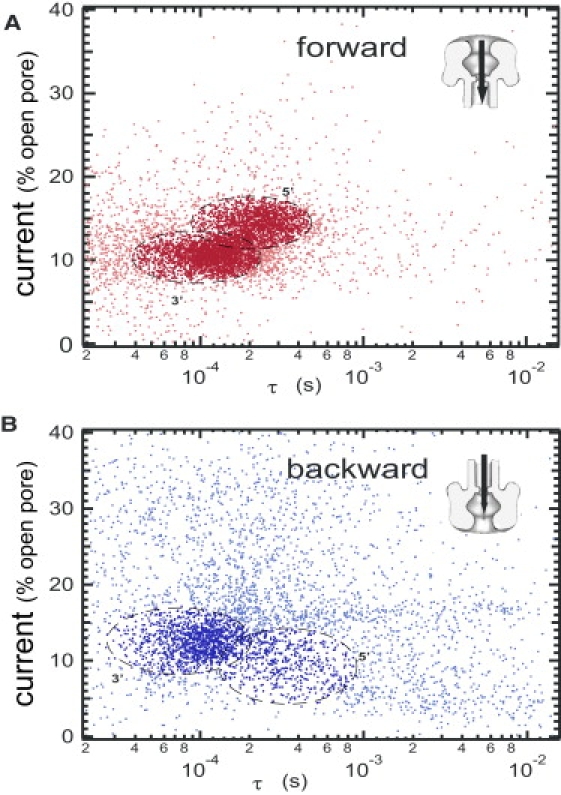
Scatter plot of the normalized blocked current as a function of the event durations in the forward and backward directions. We discriminate two groups of events. The dark-colored events are identified as true translocations. The light-colored events are identified as blocked molecules or aborted translocations. The first group represents 90% of the 5700 events in the forward direction (A) and 62% of the 4700 events in the backward direction (B). In the forward direction, note the bimodal distributions corresponding to DNA, translocating with their 3′ and 5′ end first. In the backward direction, the bimodal distribution turns into a major cluster with a long tail to the low current and long time. We attribute the main cluster to DNA translocating with their 3′ end first and the tail to the other DNA orientation. See text for the clustering criteria.