
Figure 6.
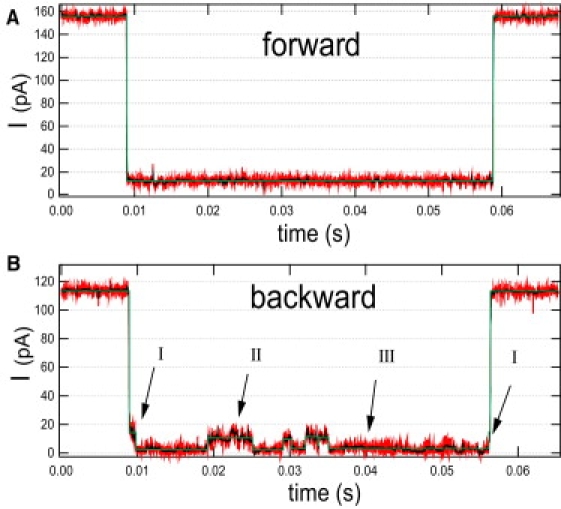
Typical traces for translocation events of hppolyA at 150 mV. The raw data is acquired at 105 S/s and filtered at 10 kHz (red). The nonlinearly filtered data (black) and the multistep analysis (green) are presented for both translocation directions. (A) In the forward direction, the event has a well-defined blocked current level. (B) In the backward direction, the translocation events present a steplike noise with three levels: a high (I) level that occurs only at the beginning and end of the event; an intermediate level (II); and a low level (III). Histograms of these level values are shown on Fig. 7.