
Figure 7.
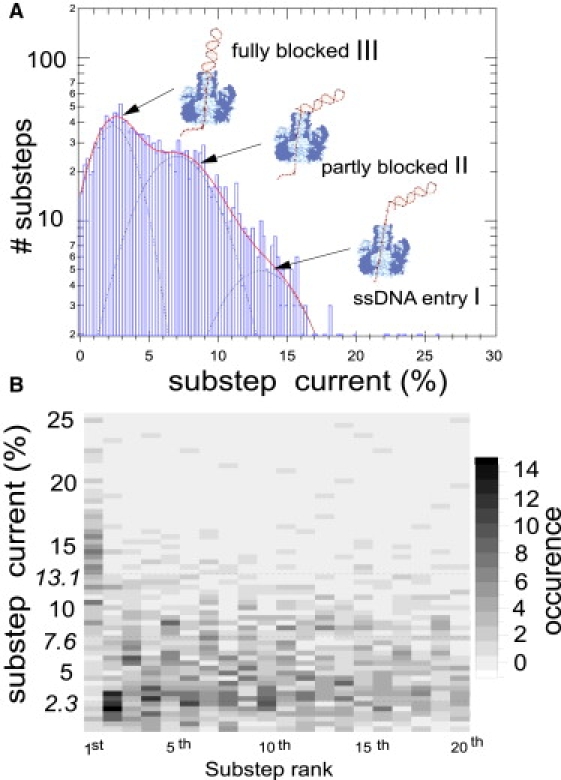
(A) Histogram of the normalized substep levels. The three-Gaussians fit (continuous line) has a major maximum at 2.3%, type III; an intermediate one at 7%, type II; and a minor maximum at 13.1%, type I. (B) Two-dimensional histogram of the sublevels versus the substeps number (up to the 20th substep). Eighty-five-percent of the first substeps have a blocked, type-I current. Eighty-five-percent of the second steps have type II values. Ninety-percent of the translocations end with a type-I sublevel. We have checked that this is not an artifact occasioned by the steep fall (respectively, rise) of the current from (respectively, to) the open pore level. This value of 13% is reminiscent of the blocked current value found for ssDNA entering with its 3′ end first on Fig. 2. Two-hundred-and-thirty translocations were analyzed. We interpret the different blocking levels as: I, the single-stranded overhang alone in the pore; II, the double-stranded part of the DNA partially blocking the trans pore entrance; and III, the double-stranded part lodged in the pore entrance cavity as depicted in panel A.