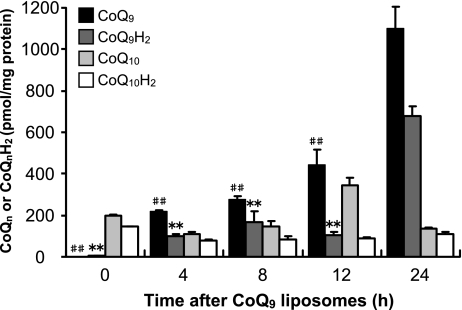
Fig. 1.
Changes in contents of CoQn and CoQnH2 in HepG2 cells after exposure to CoQ9 liposomes. HepG2 cells were exposed to CoQ9 liposomes (10 µM) and harvested after 4, 8, 12, or 24 h. Intracellular CoQ9, CoQ9H2, CoQ10, and CoQ10H2 were measured by HPLC as described in Materials and Methods. Data points represent the means ± SE (n = 3). **p<0.01 vs CoQ9H2 at 24 h, ##p<0.01 vs CoQ9 at 24 h.

