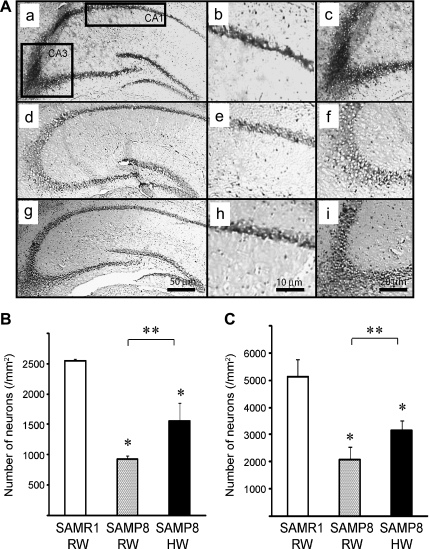
Fig. 3.
Panels (A) show representative photomicrographs of Klüver-Barrera’s stained brain sections of SAMR1 mice (a, b and c), SAMP8 mice treated with RW (d, e, and f) and SAMP8 mice treated with HW (g, h and i). Panels (b, e, and h) are representative images of CA-1 and panels (c, f, and i) are representative images typical images of CA-3, respectively. The number of Klüver-Barrera positive cells in CA-1 (B) and CA-3 (C) for each treatment group. (n = 4 for each group, *p<0.05, in comparison to age-matched SAMR1/RW, #p<0.05, SAMP8/RW vs SAMP8/HW; RW, regular water; HW, hydrogen water).

