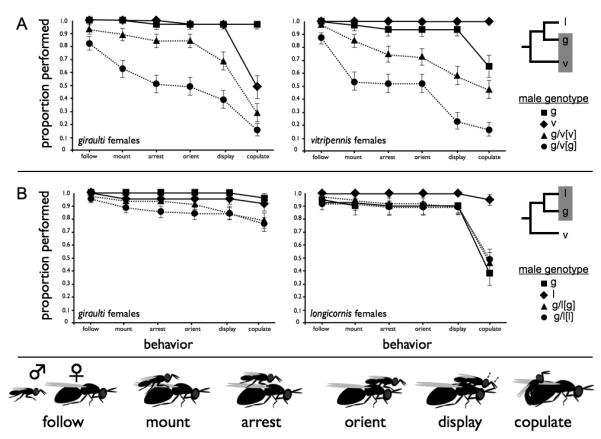
Figure 1.

Proportions of males of each class that performed each of the six stages of courtship behaviour is plotted, with the sequential order of courtship stages along the X-axis. (A) Older species pair (vitripennis-giraulti) using giraulti females (left) and vitripennis females (right). (B) Younger species (giraulti-longicornis) pairing giraulti females (left) and longicornis females (right). Courtship behaviours shown (bottom) and are described in Table 1. Standard deviations for proportions were obtained by transforming proportions into angles (theta) via the arcsine square-root transformation. Variances of the angles were then calculated and used to determine standard deviations of theta. Standard deviations were then back-transformed to give values in proportions for visual presentation. Error bars are one standard deviation.
