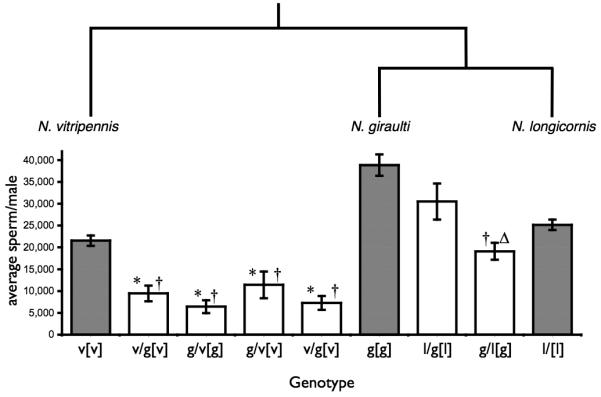
Figure 2.

Average total sperm production per male in parental and F2 hybrid males. The phylogenetic relationship between Nasonia species is shown (top). Average sperm production per 2-3 day old male is shown (bottom). Genotypes are given as maternal/paternal[cytoplasm]. Shaded bars are parental strains, white bars are hybrid crosses. (*) significant difference from vitripennis (‡) significant difference from giraulti(Δ) significant difference from longicornis. Error bars are SEM.
