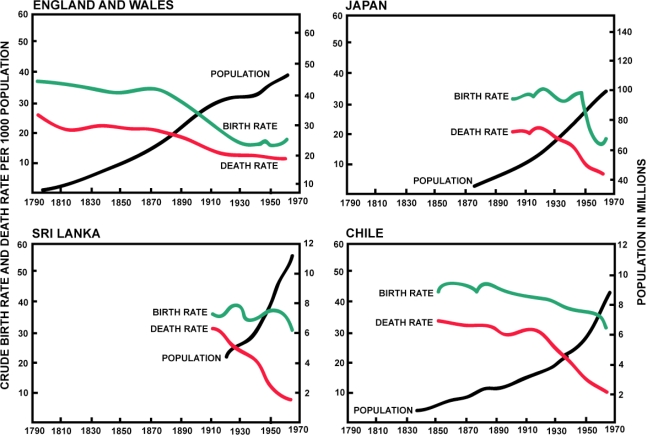
Figure 1.
Birth rates, death rates, and population size over the last two centuries in four different areas, illustrating the demographic changes that prompted the development of the epidemiological transition model. Modified from Omran [4] with permission to reprint from John Wiley and Sons.

