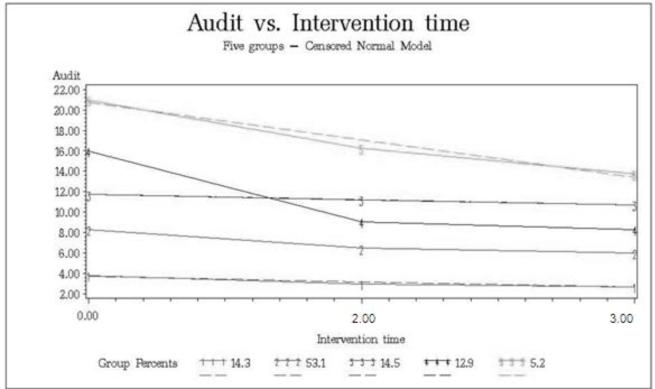
Figure 1.
AUDIT trajectories including year 0, 2 and 3 (no data is available for year 1, see section 3.4). Trajectory groups: stable low (1; 14.3%), medium decreasing (2; 53.1%), stable high (3; 14.5%), high decreasing (4; 12.9%) and very high decreasing (5; 5.2%). Solid lines represent actual values, dotted lines represent fitted values.

