
Figure 6.
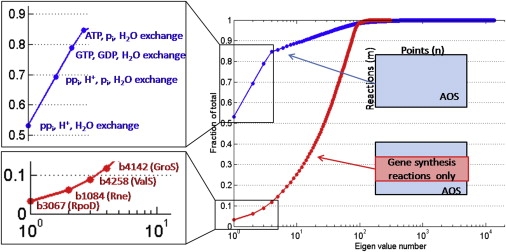
Principal component analyses (PCA). Z scores of the entire Ecoupled-matrix network (A) and of the gene expression reactions (B). The PCA analysis was performed on the set of alternate optimal solutions (AOS) (doubling time t = 90 min). Note that there are m reactions in the network and the number of AOS (points) is n = 2m.