
Figure 1.
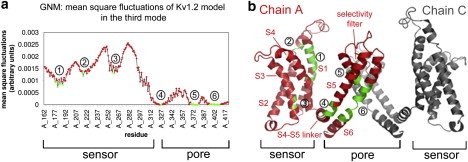
Identification of hinges in the third fluctuation mode. (a) MSF. The minima, corresponding to the hinges, are labeled in green and marked 1–6. (b) Two juxtaposed monomers of Kv1.2's model structure (5): chain A (red) and chain C (gray). Transmembrane helices S1–S6 are marked in red, and the six hinge regions (green) are marked by the gray encircled numbers. The figure was prepared using PyMol (71).